

An AI trading signal suggests a possible entry or exit; AI trade analysis examines market conditions or a completed trade to explain the setup, structure and execution. AI trading analysis software can support that deeper review, but it can’t turn an alert into a dependable trading decision or remove market risk. A 2024 customer advisory warned that AI can’t make trading bots money machines.
For South African forex traders, the distinction matters: a signal points to a possible action, while analysis helps you assess the reasoning and risk behind it. This guide explains how they differ, compares key types of trading tools, and outlines what to consider when weighing their value and limitations. It also shows why data quality, market context, and disciplined risk management matter when software generates analysis. Use this framework to judge whether AI trading analysis software supports your process or simply adds another alert to follow.
Key Takeaways
- Assess whether a tool explains its chart findings and market context, not just whether it displays a pattern or alert.
- Compare platforms by their analysis features, workflow fit, and pricing structure rather than by promotional claims alone.
- Evaluate how a trading algorithm is developed and tested before considering live deployment.
- Use trade reviews and execution records to identify where your process can improve.
- Keep human judgment and risk controls central when using automated analysis in changing forex markets.
AI-powered market analysis
AI trading analysis software processes price and chart data to identify patterns, possible market bias, and potential setups. Its output depends on the data supplied, the selected timeframe, and the model’s rules.
For South African traders, ZAR account support, local payment methods, and tax reporting depend on the platform and connected broker. Treat each as a separate capability: review account-currency settings and payment options, and check whether you can export trade records for tax preparation.
Market and Asset Coverage
Market coverage varies significantly between platforms. A forex-focused tool may analyse currency pairs, while another may also cover stocks, indices, or other instruments. Before relying on its output, identify the exact assets and data feeds available for the market you intend to trade.
For example, a trader comparing EUR/ZAR with a share listed on the Johannesburg Stock Exchange needs to know whether both charts are supported. Review the instrument list, market hours, chart intervals, and historical data available for each asset. Platform coverage does not necessarily mean every analysis feature works across every market.
StockHero is relevant when evaluating bot creation and strategy access. Compare the assets its tools support with your watchlist, then review how the platform handles price data for each instrument. In South Africa, distinguish an account denominated in ZAR from access to ZAR currency pairs. These are different requirements.
Pattern Detection and Market Bias
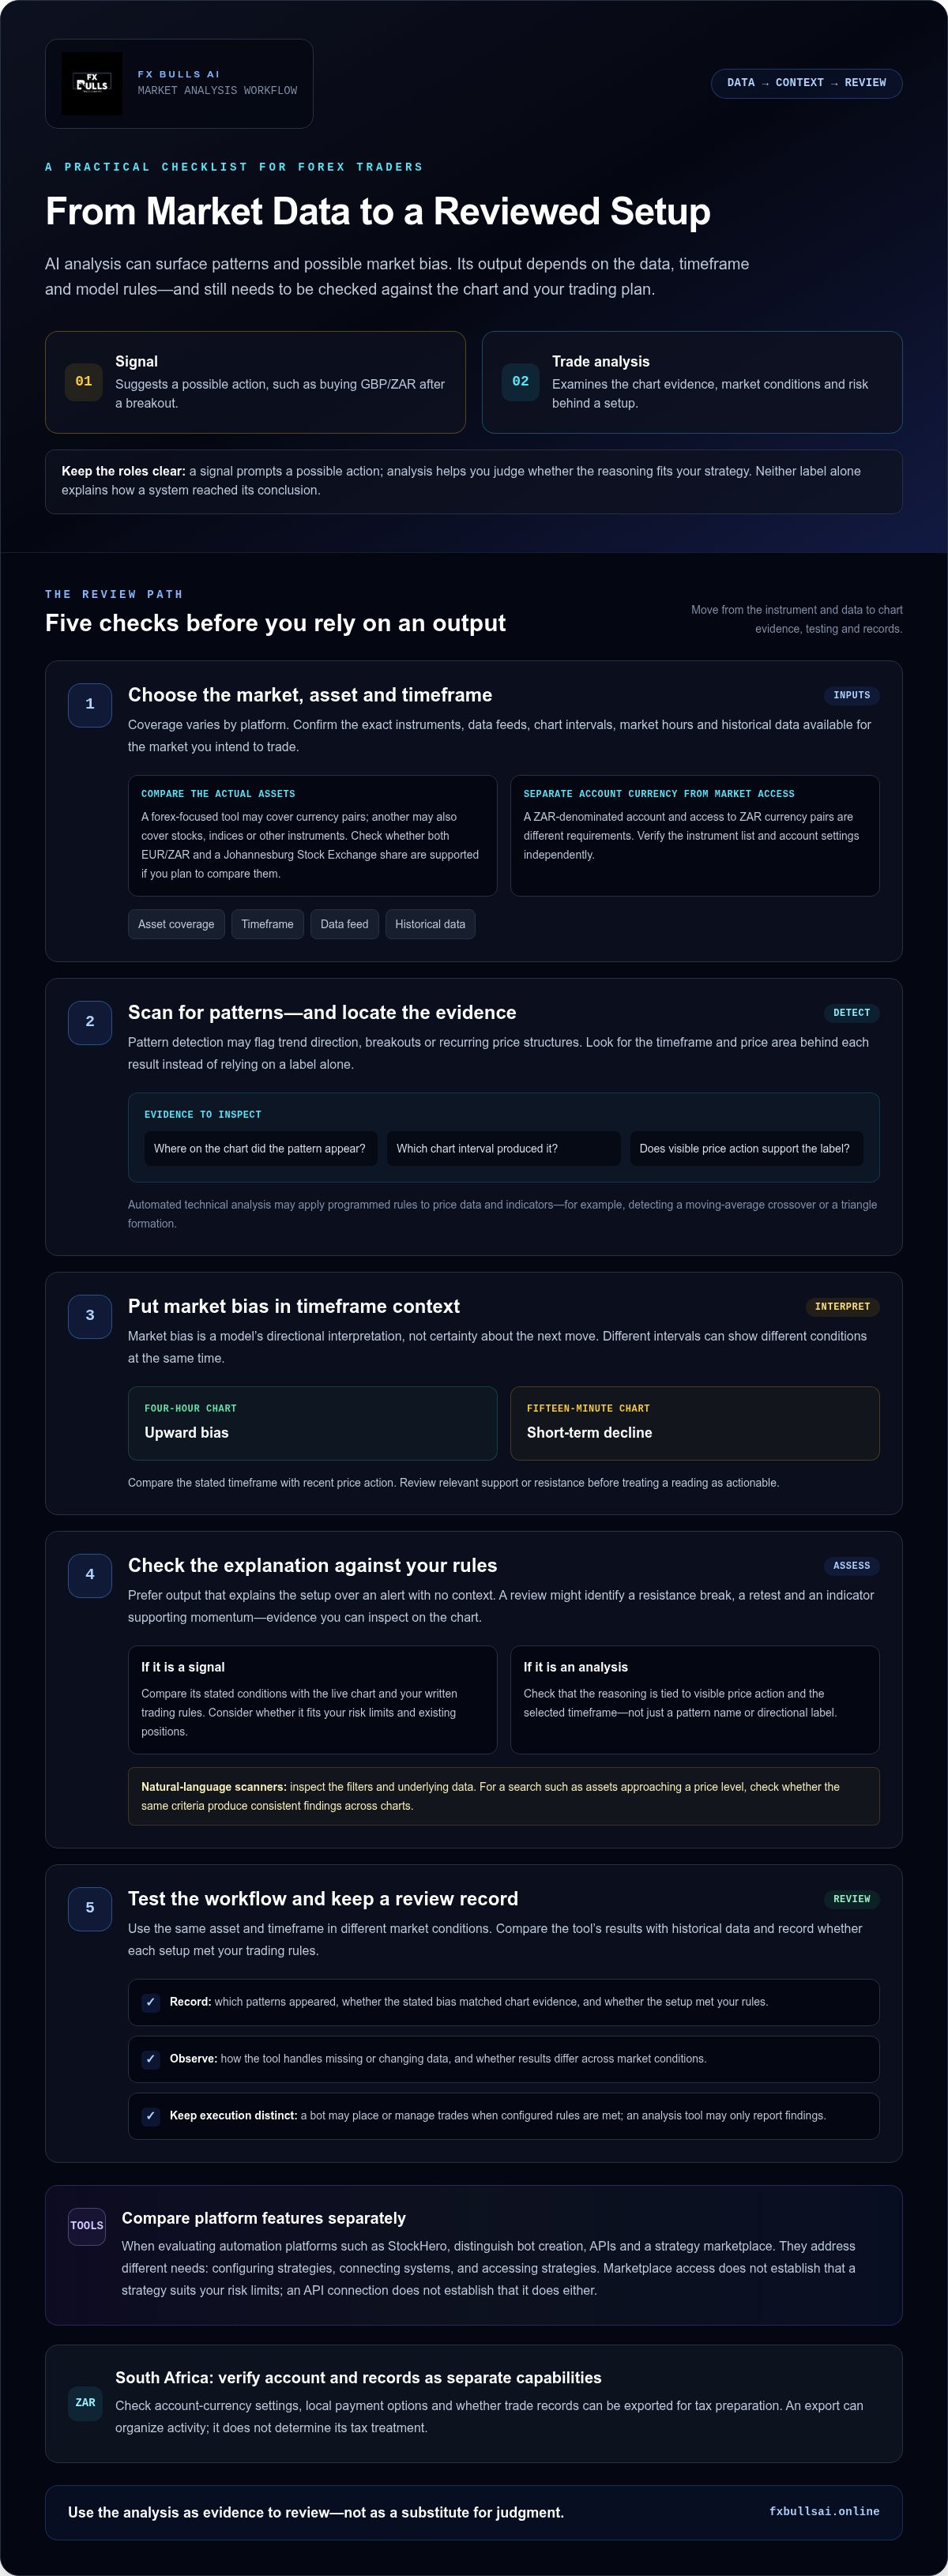
Pattern detection turns chart movement into signals such as trend direction, breakouts, or recurring price structures. Useful analysis identifies the timeframe and price area behind a setup. Without that context, a pattern label can be difficult to evaluate or compare with your own chart reading.
Market bias describes a model’s directional interpretation, not certainty about the next move. For instance, an upward bias on a four-hour chart can coexist with a short-term decline on a fifteen-minute chart. Compare the timeframe and recent price action, and review relevant support or resistance before treating the reading as actionable.
Check whether the platform explains its output in plain language or simply displays an alert. A natural-language market scanner can help traders search for conditions using written criteria, such as assets approaching a price level. Review the filters it applies, the data behind its results, and whether the same criteria produce consistent findings across charts.
AI Market Analysis Workflow
A practical workflow moves from data selection to scanning, interpretation, and review. Choose an asset and timeframe, scan for patterns, and inspect the chart locations behind each result. Compare the output with historical data, then record whether the setup met your trading rules.
When assessing automation platforms, compare StockHero’s bot creation, APIs, and strategy marketplace as separate features. Bot creation concerns how users configure strategies, APIs connect systems, and a marketplace provides access to strategies. Marketplace strategies still need clear rules, and an API connection does not show that a strategy suits your risk limits.
Next, test the workflow using the same asset and timeframe in different market conditions. Record which patterns appear, whether the stated bias matches the chart evidence, and how the tool handles missing or changing data. Separately review account and export settings for ZAR accounts, payment methods, and tax records. An export can organize activity, but it does not determine its tax treatment.
What is the difference between AI trading signals and AI trade analysis?
An AI trading signal presents a possible action, such as buying GBP/ZAR after a breakout. AI trade analysis examines the chart evidence, conditions, and risk behind that setup. The distinction is practical: a signal prompts action, while analysis helps traders judge whether the setup fits their strategy. Neither label alone explains how the system reached its conclusion.
Automated technical analysis applies programmed rules to price data and indicators. A system might detect a moving-average crossover and flag a potential trend change. Advanced pattern recognition can also scan for formations such as triangles or head-and-shoulders structures. Review the chart interval and price area behind each finding. A pattern on a short interval may not support the same interpretation on a longer one.
Signals often condense analysis into a direction, entry area, or alert. Some platforms send notifications as soon as predefined conditions appear. That speed can surface opportunities, but it does not explain whether a setup fits your risk limits or existing positions. Before acting, compare the signal’s stated conditions with the live chart and your written trading rules.
Trade analysis goes further by describing a setup’s components. For example, it may identify a resistance break, a retest, and an indicator that supports momentum. This gives you specific evidence to inspect rather than a single instruction to follow. Automated chart and pattern recognition can speed up scanning, but each label should remain tied to visible price action and the selected timeframe.
Trading bots add another layer: strategy execution. A bot can automatically place or manage trades when configured rules are met, while an analysis tool may only report findings. Strategy creation defines conditions such as entry triggers and exit logic. Backtesting applies those rules to historical data. Before considering deployment, compare the test assumptions with live-market conditions, including spreads, slippage, and changing volatility.
Use a simple sequence: inspect the chart, identify the detected pattern, review the analysis, then decide whether a signal meets your plan. Keep execution automation separate from analytical output, since each performs a different task. For traders comparing chart interpretation features, AI chart analysis can help make market structure easier to review without treating an alert as a trading decision.
How Do the Top 5 AI Trading Tools Compare?
Compare five tool types by their analysis, automation, asset coverage, and subscription limits rather than assuming one ranking suits every trader. In South Africa, regulatory treatment depends on whether a service analyses charts, arranges transactions, or executes trades. Assess the broker and service model separately from software pricing.
Pricing and Subscription Costs
Subscription structures vary by function. A chart-analysis platform may charge for advanced indicators or scanner access, while a bot builder may price around automation features or connected accounts. API-based systems can add costs for data access or usage. Compare the full workflow, not just the advertised entry tier.
These five tool types serve different needs:
- Chart-analysis platforms scan technical patterns and market conditions.
- Bot builders let users configure automated strategy rules.
- API-connected tools link analysis with external trading systems.
- Strategy marketplaces provide strategies users can assess and apply.
- Forex and CFD services combine market analysis with trading workflows.
For each tool, compare asset coverage, data access, automation, and usage caps. A tool focused on crypto may not support a forex workflow. South African traders should also distinguish subscription charges in R from separate broker fees, spreads, or transaction costs.
Before subscribing, match the cost to your actual needs. If you only need chart insights, a bot-focused plan may include features you will not use. If you plan to run several strategies, check that the plan’s limits cover your instruments, data needs, and connected accounts. Include renewal terms and cancellation conditions in your cost comparison.
Free Plans and Trials
A free plan can show how a platform presents charts, patterns, and alerts, but may restrict scanned assets, historical data, saved setups, or automated actions. A trial may temporarily unlock more features, but duration and included functions vary by provider. Read the displayed plan terms before relying on access.
Use a consistent test workflow. Select one currency pair, apply the same timeframe, and record the tool’s analysis and alert conditions. Then compare the output with your own chart review. This helps you assess whether the platform offers useful insights or mainly surfaces technical labels without enough context.
Test practical limits, too. Check whether the free tier supports your preferred market, exports trade records, or connects to your intended broker. For a bot, determine whether testing is simulated or places live orders. A successful demo workflow does not show that a strategy will perform similarly in different market conditions.
For South African traders, review how the subscription is billed and whether the payment method works for your account. Assess each platform against the same criteria: coverage, useful analysis, limits, and fit with your workflow. That comparison helps distinguish an appealing free trial from a tool you can use consistently.
How Do You Choose the Right AI Trading Tool?
Choose a tool by matching its analysis, testing, and execution features to your trading process. Beginners can take a controlled evaluation path, starting with chart review and moving to simulated testing before any live action.
Strategy Development and Deployment
Start by defining your strategy in plain language, such as entering after a confirmed price breakout. Then identify the exact conditions that trigger entry, exit, and risk controls. If a platform supports coding, make sure its rules are inspectable rather than hidden behind a single performance score.
Before live deployment, map each rule to an observable market condition and check how the system handles conflicting signals. A day trader’s short-term entry logic can differ sharply from an investor’s longer-term approach. Review order types, position-sizing controls, and pause settings so automated actions stay within your defined process.
Backtesting and Forward Testing
Backtesting applies a strategy to historical data to show how its rules would have behaved. Review the selected market, timeframe, data quality, and assumptions about spreads and slippage. A strategy that performs well on one currency pair can behave differently on another, so examine results across varied market conditions.
Forward testing evaluates the same rules on new or simulated market data. Run the test without changing the strategy after each signal, then record entries, exits, and missed setups. Comparing forward-test results with backtest findings can help identify overfitting, where rules match historical examples but fail to adapt to new price behaviour.
Beginner Setup Steps
Beginners can use AI trading analysis software in a controlled sequence: select one market and timeframe, then review the tool’s chart analysis. Compare its signals with visible price action and record the reason for each potential setup. Use simulation to observe how the rules behave before considering live execution.
- Choose a platform and read its feature and data permissions.
- Select a market and timeframe that fit your intended workflow.
- Record the tool’s analysis and compare it with your own chart review.
- Test the strategy in a simulated environment and review each outcome.
Keep a journal of your decisions and results. It gives you a clear record for assessing whether the tool improves your process or simply adds more alerts.
Platform Legitimacy and Security
To assess legitimacy, identify the operating business, its stated services, and the legal entity behind the platform. Where relevant, compare claims about trading, custody, and execution with official South African records. A software label alone does not establish that a broker or trading service has the permissions required for its activities.
For security, review account protections, data-handling terms, and the permissions requested when connecting a broker account. Use strong, unique credentials and available multi-factor authentication. Check whether API access can be limited to necessary functions, and revoke unused connections. Avoid granting withdrawal permissions when your workflow only requires market data or trade analysis.
Before committing to a live strategy, test the platform’s controls. Confirm how to disconnect integrations, export records, and pause automation. These checks help you distinguish analytical support from execution authority and choose a tool that fits your risk process.
Limitations and value of AI trading tools
AI analysis can scan market data consistently, identify chart structures, and apply custom rules across selected instruments. That value is practical: a tool can highlight price levels for review and help traders document why a setup met their criteria. It cannot make trading bots money machines. A 2024 customer advisory warned against treating AI as a shortcut to reliable profits.
Analysis depends on its inputs. Gaps in historical data, incorrect timestamps, or pricing that differs from your broker can distort a chart. A model trained on quiet conditions may also respond poorly when volatility changes. Check the instruments and timeframes supported, then compare findings with the live chart and your trading rules.
Pattern recognition has limits. A system might label a price move as a breakout, only for the next candles to fall below the same level. Treat that label as a prompt to inspect context, not proof of a trade. Review the surrounding structure, selected timeframe, and conditions the tool uses to define the pattern.
Automation brings a separate execution risk. A bot can apply a rule consistently, but it can also repeat a flawed rule without pausing to interpret an unusual event. For example, a strategy that enters after a price threshold could behave differently during rapid price movement or when execution costs change. Set clear position limits and keep a way to pause automation.
Testing helps reveal weaknesses before a strategy enters a live workflow. Compare backtest assumptions with actual market data, then forward-test the same rules without changing them after each outcome. Record the entry logic, exit conditions, and differences between expected and observed execution. A journal that scores timing and screenshot-based execution quality out of 10 can make recurring process errors easier to spot.
Measure usefulness by process quality, not a headline win rate. Ask whether the tool explains its findings, uses relevant data, and helps you follow defined risk controls. If its output cannot be traced to chart evidence or a repeatable rule, it adds noise rather than decision support. Review each result before deciding whether to act.
Use AI to strengthen analysis and review, while keeping responsibility for trading decisions with you. Explore AI-driven Forex and CFD analysis to assess chart structures and support a more systematic review process.
FX Bulls AI: AI-Driven Forex/CFD Trading Service
FX Bulls AI offers an AI-Driven Forex/CFD Trading Service and an AI chart analyser for traders seeking structured chart insights. The analyser identifies support and resistance levels, alongside ICT structures such as liquidity sweeps, order blocks, and fair value gaps. These findings give you specific chart features to assess against your trading rules.
Use the AI chart analyser to examine market structure systematically, or explore the trading service for AI-driven Forex and CFD trading. Analysis can inform your review, but it does not remove market risk or guarantee an outcome. Choose the option that fits your workflow and keep risk controls central.
Visit FX Bulls AI online to learn more.
Put Your Next Trading Decision on a Clearer Track
Decide what you want technology to improve: chart interpretation, trade review, or a more structured trading workflow. Set a practical evaluation goal before adopting AI trading analysis software. For example, record whether its market observations help you apply your existing rules more consistently. Focus on evidence and process, not on expecting software to make every decision.
FX Bulls AI offers an AI-Driven Forex/CFD Trading Service and an AI chart analyser. Consider how these offerings fit the analysis you want to incorporate into your Forex or CFD routine, while keeping your own risk controls in place.
Build a disciplined approach: define what you want to assess, review the tool’s output, and make deliberate decisions. If you’re ready to discuss how FX Bulls AI may fit your needs, contact FX Bulls AI to discuss your needs. Move forward with a clear process and informed judgment.
Frequently Asked Questions
Can AI replace a human trader?
No. AI can support analysis and automate defined tasks, but it does not replace human judgment. You still decide whether a position fits your objectives, risk limits, and understanding of market conditions. An unexpected announcement, for example, can change the context behind a chart setup. Reassess exposure and pause a strategy when needed rather than relying only on the software’s previous reading.
Do AI trading bots actually work?
AI trading bots can carry out programmed actions, but that does not mean they will be profitable. A bot may follow entry and exit rules consistently, yet its results depend on those rules, data, execution conditions, and market behaviour. Review what the bot is designed to do, then test it in simulation. Make sure you understand how to stop it and manage open positions.
Why Use It?
Use AI tools to structure repetitive analysis and record-keeping. For example, a trader reviewing several currency pairs can use a scanner to flag charts that match chosen conditions, then focus on those charts. A journal can also help reveal recurring process mistakes. The tool supports review and consistency; it does not make decisions or guarantee a trading outcome.
What are the best AI trading analysis platforms available in South Africa?
There is no single best platform for every South African trader; the right fit depends on your market, workflow, and required features. FX Bulls AI offers an AI chart analyser and an AI-Driven Forex/CFD Trading Service. Compare supported instruments and account compatibility with your needs. Chart-analysis software is not interchangeable with a broker or service that handles transactions.
How do AI trading analysis tools compare in features and accuracy?
Compare tools by the specific task they perform and how clearly they present results. One platform may focus on chart scanning, while another supports strategy automation or trade records. Accuracy is not a universal rating: it varies with the asset, timeframe, data, and definition of a correct result. Test the same setup criteria across tools, then review where their outputs differ and why.
How much does AI trading analysis software cost in South Africa?
Costs vary by platform, features, usage limits, and billing terms, so compare the full subscription structure rather than an advertised entry tier. FX Bulls AI’s price depends on the case and is provided after a quote request. Relevant cost factors include the service scope and selected features. For other tools, review renewal conditions and any separate broker or transaction costs before committing.
Which brokers and markets do AI trading tools support?
Support depends on a tool’s integrations, available market data, and listed instruments. Match your broker and intended assets against its compatibility details before relying on a platform. Check whether it covers the specific currency pairs or CFDs you trade, rather than assuming forex support includes every pair. FX Bulls AI focuses on Forex and CFD trading tools, not stock, ETF, or pension investing.
What are the risks and limitations of AI trading signals and predictions?
AI outputs can reflect incomplete data, changing market behaviour, or assumptions that don’t fit current conditions. A signal may arrive promptly yet still be unsuitable for your position or risk limits. Models can also identify patterns that fail to continue. In 2024, the CFTC published a customer advisory warning that AI cannot make trading bots money machines. Treat predictions as inputs for review, not instructions.
